Collapsing Flat Prices in Acton Give Developers Headache
Average value of a W3 apartment down by 15% over last year
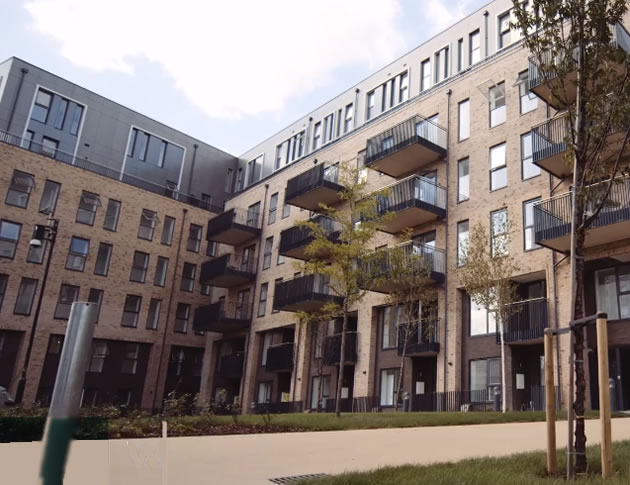
Flats in the Vida development the only new builds to sell this quarter
The average price of a flat in Acton has dipped below £400,000 for the first time in three years. The figures from the Land Registry are likely to increase concerns that the significant number of new developments in the area will find it difficult to find buyers.
During the third quarter of this year only three sales of newly built flats have been reported, all in Granta Court, Trinity Way, the development close to the A40 off East Acton Lane.
The average price of a flat sold in the three month period in the W3 post code area was £374,311 down by 15.5% over the last year. Over the last decade the average price of this kind of property is up by just 38.2%
Overall property prices are down by 9.7% over the last year to £592,446 with sustained demand for larger properties supporting the level.
One local property expert commented, "Falling prices of flats in the secondary market are very bad news for developers. It means that they could be undercut by their own units if they try and maintain prices. If I was a buyer at the moment I'd be looking for very generous incentives from developers and there is anecdotal evidence they are currently prepared to offer these. It could turn out to be a fantastic opportunity because the buyers' strike will end if Brexit is resolved."
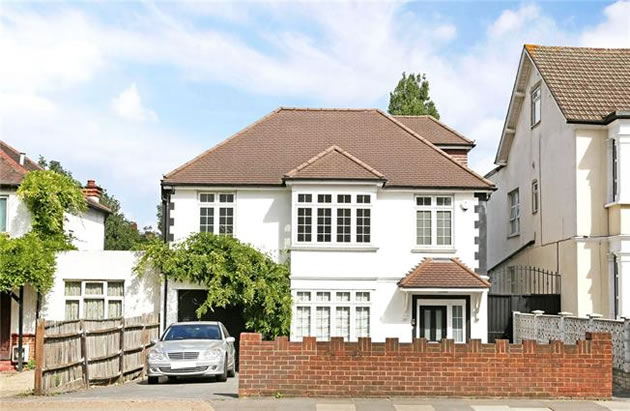
House on Old Oak Road went for £1,475,000.
There continues to be buying interest in larger family houses in the area with several sales above the million pound mark reported recently. These include a five bedroom semi-detached property on Old Oak Road that went for £1,475,000 against a guide price of £1,550,000 and two houses on Emanuel Avenue and Goldsmiths Avenue that went for £1,450,000 and £1,350,000 respectively.
We have asked a number of the developers in the Acton area for a comment on the Land Registry figures but have not yet received a reply.

The latest figures from the Nationwide's House Price Index show that prices nationally have continued to rise slowly with the average sale price now £214,534 up by 1.6% over the year.
Commenting on the figures, Robert Gardner, Nationwide's Chief Economist, said, “Looking further ahead, much will depend on how broader economic conditions evolve. If the uncertainty lifts in the months ahead, there is scope for activity to pick-up throughout next year. The squeeze on household incomes is already moderating and policymakers have signalled that interest rates are only expected to raise at a modest pace and to a limited extent in the years ahead.”
The October 2018 RICS UK Residential Market Survey results show the recent softening in new buyer demand beginning to feed into a slightly negative trend for national house prices in the view of the surveyors’ industry body.
The report says, “A sustained softening in demand over recent months has likely driven the weaker price trends in parts of the country. The net balance for new buyer enquiries ticked down to -14% in October (compared with -12% last month), marking three successive reports in which headline demand has deteriorated. Affordability pressures, political uncertainty and a lack of fresh stock coming onto the market all continue to hinder activity to varying degrees.”
The report adds that new instructions to surveyors continue to fall meaning stock levels remain close to all-time lows and rendering any chance of a meaningful turnaround in the near future unlikely. A net balance of 30% of respondents reported the level of appraisals being undertaken to be down on an annual comparison.
Looking ahead, respondents in London and the South East were the most negative with price falls expected over the next twelve months.
There are regular updates on the local property market in the ActonW3.com newsletter. To register to receive it .
| Acton Property Prices (July - September 2018) | ||||||||||
|---|---|---|---|---|---|---|---|---|---|---|
| Area | Detached | Sales | Semi-det | Sales | Terraced | Sales | Flat/ mais |
Sales | Overall Ave |
Total Sales |
| W3 0 | 0 | 0 | 763500 | 4 | 666667 | 3 | 485000 | 1 | 692375 | 8 |
| W3 6 | 0 | 0 | 1168000 | 5 | 923988 | 4 | 373600 | 15 | 630831 | 24 |
| W3 7 | 0 | 0 | 700000 | 3 | 835000 | 7 | 358153 | 15 | 532692 | 25 |
| W3 8 | 0 | 0 | 0 | 0 | 955833 | 3 | 419500 | 7 | 580400 | 10 |
| W3 9 | 1400000 | 1 | 1095000 | 2 | 0 | 0 | 352562 | 8 | 582773 | 11 |
| Total | 1400000 | 1 | 941714 | 14 | 847556 | 17 | 374311 | 46 | 592446 | 78 |
| Change in Quarter | - | - | 9.0% | 40.0% | 14.6% | -10.5% | -16.0% | -39.5% | 4.6% | -27.8% |
| Change in year | - | - | -15.8% | -30.0% | 1.1% | -5.6% | -15.5% | -23.3% | -9.7% | -21.2% |
| Change in three years | - | - | -12.0% | -51.7% | 7.2% | -45.2% | -9.5% | -67.6% | 3.2% | -62.1% |
| Change in five years | - | - | 15.3% | -44.0% | 34.6% | -57.5% | 22.3% | -66.7% | 29.8% | -62.9% |
| Change in ten years | - | - | 107.6% | 55.6% | 106.5% | -10.5% | 38.2% | 7.0% | 78.8% | 9.9% |
November 22, 2018
Related links
|