Only Eleven New Flats Sold in Ealing So Far This Year
Developments with high affordable component 'hard sell' says agent
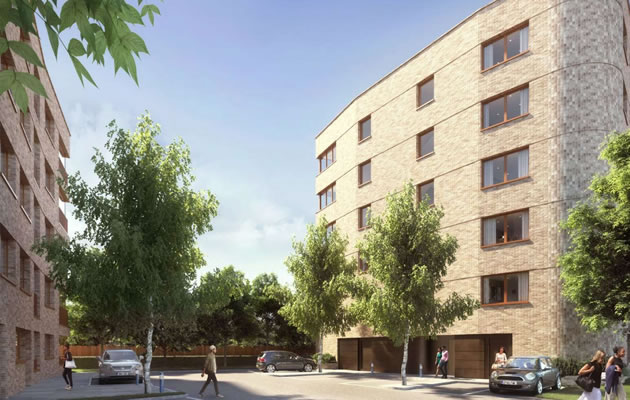
Relph Court the only development to report sales this quarter
Despite the large number of new flats being built and in the pipeline in the Ealing area, the latest official figures suggest that very few are currently being sold.
According to the Land Registry, in the year to September, only 11 new build units have been purchased in the W5 and W13 post code areas.
Donald Collins sales director of GoView estate agents said, “A 50% drop in sales volumes in W5 and 43% drop in W13 over 5 years are certainly headline grabbing numbers, but readers should not be too perturbed and actually this supports the value of their homes but is bad news for estate agents! Not that we are expecting any sympathy!
“There is simply less property available to buy on the resale market, and this helps support value. The market in Ealing has changed considerably in the 15 years I have been an agent. You have families now staying for longer in the one house, due to perhaps the trading gaps between terrace – semi-detached – detached being so much coupled with a hefty stamp duty regime. So you simply do not see the same fluidity to the market as you would have done 10 years ago."
Some local estate agents are expressing concerns about a potential glut in Ealing and across London with one describing the current property market as dysfunctional.
He said, "The market price flats in a development are a really hard sell at the moment particularly if there is no Help to Buy support. A big turn off for buyers is when a block has a high 'affordable' content. This isn't down to snobbery as most of the people in these units are professionals but people don't like to be in a position where they feel someone else is paying less for the same thing.
"There is always plenty of demand for the discounted units but they don't show up in the figures but the market price units are not moving. For the developer that is where the margin is so the market is thoroughly dysfunctional at the moment."
It is suggested that it is only because the government are directing banks to keep lines of credit open to the developers that they are not encountering cashflow problems. In some cases it is believed that the developers are keeping units on their books and renting them out rather than selling them.
The sales data shows that turnover in the local market remains low by historical standards but hasn't had the kind of catastrophic decline seen in other parts of London.
There have been 102 properties reported as sold in the W5 postcode area in the third quarter of the year at an average price of £743,412 down by 3.3% compared with the same period last year. Within these sales, house prices have generally performed better than flat prices although low volumes make comparisons difficult.
Donald Collins adds, “Furthermore, when an investor owns a property that property does not tend to return to the market for the next 10 -15 years, given the investor has taken a long term view. While there is a low supply in the market, i.e. the above trend continues of people staying in the market long term, then prices will remain strong as plenty of people with a low interest mortgage rate are looking to purchase at the right price point.
“The key thing to remember is that every property, every situation is different. Speak to a good local independent agent and get the right advice for you.”
| Ealing W5 Post Code Area Property Prices - (July - September 2019) | ||||||||||
|---|---|---|---|---|---|---|---|---|---|---|
| Area | Detached | Sales | Semi-det | Sales | Terraced | Sales | Flat/mais | Sales | Overall average | Total sales |
| W5 1 | 1820000 | 1 | 977200 | 5 | 875000 | 4 | 382600 | 5 | 807933 | 15 |
| W5 2 | 1862500 | 2 | 1530250 | 2 | 926000 | 1 | 496824 | 17 | 734432 | 22 |
| W5 3 | 1460000 | 3 | 1221667 | 3 | 0 | 0 | 436458 | 12 | 737917 | 18 |
| W5 4 | 1100000 | 1 | 834600 | 5 | 733773 | 11 | 371125 | 12 | 613724 | 29 |
| W5 5 | 0 | 0 | 1369167 | 6 | 1030000 | 5 | 443714 | 7 | 915055 | 18 |
| Total | 1575000 | 7 | 1142833 | 21 | 840357 | 21 | 436906 | 53 | 743412 | 102 |
| Change in Quarter | 0.9% | -12.5% | 21.3% | 50.0% | 10.1% | -22.2% | -15.4% | 1.9% | 2.7% | 1.0% |
| Change in year | -23.6% | 16.7% | 6.7% | -4.5% | 4.2% | -32.3% | -12.8% | -8.6% | -3.3% | -12.8% |
| Change in three years | -20.2% | -36.4% | -9.4% | -12.5% | 8.0% | -27.6% | -14.3% | -49.5% | -1.9% | -39.6% |
| Change in five years | 0.6% | -58.8% | 6.8% | -16.0% | 18.7% | -52.3% | -2.5% | -53.1% | 9.5% | -48.7% |
| Change in ten years | 1.3% | 16.7% | 96.8% | -32.3% | 84.4% | -44.7% | 73.1% | -8.6% | 66.8% | -23.3% |
Source: Land Registry
Demand remains for large family homes with two properties selling for over £2 million including a semi-detached property in Hamilton Road that changed hands for £2,165,000.
All the newly built flats that were sold during the three months were in Relph Court near Madeley Road.
In West Ealing (W13) prices are down on average by 1.9% over the year with 60 sales recorded in the third quarter. The average probably masks a double digit fall on a like for like basis as the proportion of houses to flats being sold during the period rose. Both terraced houses and flats experienced a decline in price of around 11% compared to the same three months in 2018.
| Ealing W13 Post Code Area Property Prices - (July - September 2019) | ||||||||||
|---|---|---|---|---|---|---|---|---|---|---|
Area |
Detached |
Sales |
Semi-detached |
Sales |
Terraced |
Sales |
Flat/ |
Sales |
Overall Ave |
Overall Sales |
| W13 0 | 0 | 0 | 718000 | 4 | 628200 | 5 | 355937 | 8 | 521206 | 17 |
| W13 8 | 0 | 0 | 1310113 | 5 | 830000 | 3 | 399062 | 8 | 764566 | 16 |
| W13 9 | 1150000 | 1 | 958750 | 4 | 712378 | 18 | 427500 | 4 | 722881 | 27 |
| Total | 1150000 | 1 | 1019813 | 13 | 709762 | 26 | 387500 | 20 | 676856 | 60 |
| Change in Quarter | -24.5% | -66.7% | 25.6% | 116.7% | -7.4% | -16.1% | -2.4% | -13.0% | 0.7% | -4.8% |
| Change in year | - | - | -2.0% | -23.5% | -11.4% | 23.8% | -11.7% | -39.4% | -1.9% | -15.5% |
| Change in three years | - | - | -8.2% | 44.4% | -5.2% | 4.0% | -14.8% | -65.5% | 13.0% | -34.8% |
| Change in five years | - | - | 21.4% | 8.3% | -1.1% | -10.3% | 0.7% | -63.6% | 9.3% | -43.4% |
| Change in ten years | - | - | 72.8% | -35.0% | 70.3% | -27.8% | 64.3% | -35.5% | 72.6% | -31.0% |
Source: Land Registry
The highest price sale in the W13 post code area was a semi-detached property on Amherst Avenue which sold for £1,850,000.

The Land Registry House Price Index for August 2019 shows that overall prices were down by 1.4% in London which made it the worse performing area in the UK. For the country as a whole the average price rose by 1.3% to £234,853.
The Royal Institution of Chartered Surveyors’ (RICS) August 2019 UK Residential Market Survey reported a flat trend in demand (new buyer enquiries) at the national level, following a few months in which enquiries had increased modestly. Newly agreed sales moved slightly further into negative territory. Alongside this, new instructions to sell were broadly unchanged for the third successive report.
The Bank of England’s Agents‘ summary of business conditions – 2019 Q3 reported that the housing market continued to soften, reflecting deteriorating supply and demand. Estate agents reported softer demand in the secondary market, though demand for lower-priced properties was more resilient.
The UK Property Transactions Statistics for August 2019 showed that on a seasonally adjusted basis, the estimated number of transactions on residential properties with a value of £40,000 or greater was 99,890. This is 0.9% higher than a year ago. Between July 2019 and August 2019, transactions increased by 15.8%.
The Bank of England’s Money and Credit release reported that mortgage approvals for house purchase (an indicator of future lending) decreased in August 2019 to 65,500. This is down from the previous peak seen in July 2019 of 67,000 but remained within the narrow range seen over the past 3 years.
November 7, 2019