Shepherd's Bush's Coronavirus Death Toll Revealed
Figures suggest Wormholt Road area worst hit by disease

Detailed data about the coronavirus outbreak has been published which shows that up until the middle of last month 31 people in the Shepherd's Bush area have died from the disease.
The Office of National Statistics (ONS) have released the number of fatalities at a very local level for the first time. The data is based on the analysis of registration of deaths including the residence of the deceased between 1 March and 17 April 2020 and where coronavirus was the underlying cause or was mentioned on the death certificate as a contributory factor.
Roughly speaking Shepherd's Bush is divided into eight Middle Layer Super Output areas by the ONS. Based on a very limit set of data, the area designated as Wormholt Road in the analysis seems to have been relatively badly hit with 8 deaths. The area north of Shepherd's Bush Green had no deaths at all. In many cases the reason for a higher death rate in a particular area can be attributed to the number of care homes in the vicinity.
| Area | Covid-19 Deaths | Total Deaths | Covid-19 (%) |
|---|---|---|---|
Askew |
5 |
12 |
42 |
Shepherd's Bush West |
4 |
8 |
50 |
Shepherd's Bush South |
4 |
10 |
40 |
| Shepherd's Bush North (MSOA Hammersmith and Fulham 004) |
0 |
1 |
0 |
Brook Green |
3 |
5 |
75 |
White City |
1 |
4 |
25 |
Wormholt Road |
8 |
10 |
80 |
| Old Oak & Wormwood (MSOA Hammersmith and Fulham 001) |
6 |
12 |
50 |
Source: ONS
The neighbouring area of Ravenscourt Park North was one of the worst hit in the country with 18 recorded Covid-19 deaths but it is thought possible this was also a result of the number of care homes in the area.
There were 220 deaths in the boroughof Hammersmith and Fulham 100 of which were attributed to the virus. This gives a death rate of 96.4 putting it just outside the top ten worst hit local authority areas in the country. All of the top ten were London boroughs with Newham having the highest death rate of 144.3.
| Death Rates by London Borough to 17 April | ||||
|---|---|---|---|---|
| Borough | All Deaths | Rate | Covid-19 Deaths | Rate |
| Newham | 421 | 298.7 | 208 | 144.3 |
| Brent | 550 | 256.9 | 304 | 141.5 |
| Hackney | 304 | 263.5 | 146 | 127.4 |
| Tower Hamlets | 260 | 239.3 | 132 | 122.9 |
| Haringey | 314 | 222.1 | 168 | 119.3 |
| Harrow | 487 | 229.2 | 241 | 114.7 |
| Southwark | 320 | 219.0 | 156 | 108.1 |
| Lewisham | 393 | 244.1 | 172 | 106.4 |
| Lambeth | 361 | 233.7 | 165 | 104.3 |
| Ealing | 538 | 230.4 | 239 | 103.2 |
| Hammersmith and Fulham | 220 | 209.7 | 100 | 96.4 |
| Waltham Forest | 343 | 210.8 | 151 | 92.5 |
| Barking and Dagenham | 271 | 229.5 | 103 | 89.2 |
| Enfield | 542 | 225.9 | 220 | 91.3 |
| Barnet | 687 | 216.9 | 287 | 91.6 |
| Islington | 227 | 208.0 | 88 | 80.7 |
| Greenwich | 376 | 230.9 | 140 | 84.6 |
| Croydon | 573 | 201.0 | 252 | 88.0 |
| Merton | 320 | 228.9 | 117 | 83.0 |
| Redbridge | 441 | 209.1 | 174 | 82.9 |
| Wandsworth | 345 | 209.7 | 132 | 80.2 |
| Westminster | 274 | 164.5 | 120 | 72.3 |
| Hillingdon | 447 | 199.8 | 164 | 73.0 |
| Kensington and Chelsea | 171 | 134.7 | 84 | 66.8 |
| Hounslow | 317 | 190.0 | 120 | 69.2 |
| Havering | 516 | 199.5 | 166 | 64.6 |
| Sutton | 322 | 188.2 | 96 | 56.7 |
| Camden | 214 | 127.9 | 91 | 55.2 |
| Bexley | 381 | 165.4 | 125 | 54.8 |
| Richmond upon Thames | 229 | 136.7 | 77 | 47.0 |
| Kingston upon Thames | 241 | 178.4 | 57 | 42.9 |
| City of London | 9 | 106.2 | 3 | 35.2 |
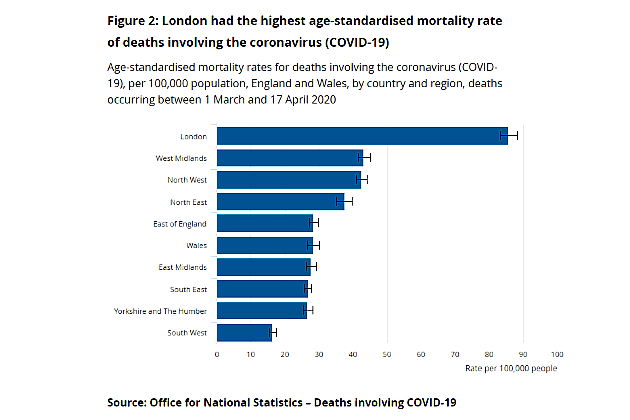
There were 90,232 deaths occurring in England and Wales that were registered by 18 April; 20,283 of these deaths involved the coronavirus. When adjusted for size and age structure of the population, there were 36.2 deaths involving Covid-19 per 100,000 people in England and Wales.
London had the highest age-standardised mortality rate with 85.7 deaths per 100,000 persons; this was statistically significantly higher than any other region and almost double the next highest rate.
The age-standardised mortality rate of deaths involving Covid-19 in the most deprived areas of England was 55.1 deaths per 100,000 population compared with 25.3 deaths per 100,000 population in the least deprived areas.

Nick Stripe, Head of Health Analysis, Office for National Statistics said, “People living in more deprived areas have experienced Covid-19 mortality rates more than double those living in less deprived areas. General mortality rates are normally higher in more deprived areas, but so far Covid-19 appears to be taking them higher still.”
Figures on deaths published by the ONS differ from those produced by the Department of Health and Social Care (DHSC) and the UK's public health agencies for two main reasons: the time between death and reporting of the death and the ONS's wider inclusion criteria.
May 3, 2020