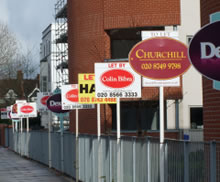
W12 Property Market Slows
Only 81 properties changed hands in first quarter of 2010
The latest figures from the Land Registry show a dramatic drop in the number of properties sold in Shepherd's Bush in the first quarter of this year.
81 houses and flats changed hands in W12 from January -March 2010 - a drop of 22.9% compared to the previous quarter.
The majority of the properties sold in this period were flats and maisonettes (57); only 24 houses in the W12 postcode area changed hands in the first three months of this year.
Despite this, London has been the best performing region of the country over the last twelve months to the end of March with the average price in the capital rising by 13% to £336,409. The rest of the country has seen rises of 7.5% bringing the national average to £164,288 although prices did fall slightly during March.
Right Move's House Price index, which is based on offered prices rather than sales prices, is showing that in April sellers ignored pre-election concerns and put prices up by 2.6% in the month. In London the average asking price is now £421,822.
Miles Shipside, commercial director of Rightmove said, “Rarer property types in desirable locations are achieving record prices. For ‘location, location, location’ you can also read ‘cash, cash, cash’. Conversely, in areas where buyers have less access to cash or mortgage finance, or there is an over-supply of a certain property type, then sellers are having to price much more aggressively to secure a sale. There is increasing divergence between these different markets, with agents reporting some pockets where a couple of viewings find a cash-rich buyer, whereas a few miles down the road it’s taking over 20 viewings to achieve a sale”.
Although political uncertainty appears to have had little impact on property in the UK thus far he expects the market to go into 'suspended animation' until a clearer picture emerges on the stability of the new Government.
Shepherd's Bush Property Prices - January - March 2010
| Area | Semi-Det | Sales | Terraced | Sales | Flat/Mais | Sales | Total Averages | Total Sales |
| W12 0 | 0 | 0 | 448940 | 9 | 340166 | 6 | 405430 | 15 |
| W12 7 | 0 | 0 | 683666 | 3 | 315016 | 9 | 407179 | 12 |
| W12 8 | 0 | 0 | 0 | 0 | 269670 | 17 | 269670 | 17 |
| W12 9 | 1105000 | 3 | 679333 | 9 | 307193 | 25 | 462401 | 37 |
| Total | 1105000 | 3 | 581212.1 | 21 | 300708 | 57 | 403220 | 81 |
| Change over quarter | -23.1% | -40.0% | 6.5% | -36.4% | 2.0% | -14.9% | -5.8% | -22.9% |
| Change over year | 102.1% | -57.1% | 59.2% | 200.0% | 7.3% | 159.1% | 15.7% | 125.0% |
Source: Land Registry
May 17, 2010
