Average Property Price in W12 Reaches New Record
Helped by Goldhawk Road house achieving highest ever sale price
The overall average property price in Shepherd's Bush hit an all time high of almost £700,000 in the second quarter of 2015.
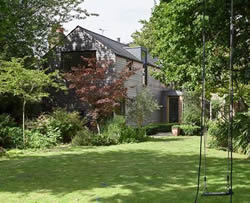
This quarter also saw the highest sale price ever recorded in W12, when a four bedroomed semi-detached house in Goldhawk Road, pictured here, changed hands for £3,575,000.
This single sale, along with a detached house which sold for £2,850,000, helped to push up the overall average by 11.8%, from £620,444 between January and March to £693,834.
At the lower end of the market however, the picture appeared more mixed, with the average price of terraced houses falling by 7.1%, from £943,725 to £876,625.
Flat prices also fell, dipping back under the half a million mark - a drop of 3.2% from £505,109 to £488,876. This news will be welcomed by first time buyers, who have increasingly been priced out of the local area.
There was also some good news for estate agents in this quarter, as business picked up following the cold winter months and the uncertainty surrounding the general election. The number of terraced house sales in particular almost doubled from 20 to 38, while the overall number rose from 86 to 117.

Across London, June data from the Land Registry showed that the average house price in the capital increased by 9.2% over the same period in 2014. This brings the average to £481,820. For England and Wales as a whole the average price rose by 5.4% to an new all-time high of £181,619. The previous record was in November 2007 before the financial crisis.
The number of completed house sales in England & Wales during April 2015 decreased by 19% to 57,180 compared with 70,244 in April 2014 and the number of properties sold in England and Wales for over £1 million decreased by 22%to 874 from 1,114 a year earlier. There were only 41 repossessions in London in April - half of the level seen a year ago.
The latest RICS UK Residential Market Survey shows that house prices continue to be squeezed higher by growing demand and contracting supply in London. While 40% more chartered surveyors saw prices rise in London in July, supply to the market continued to decline with 16% more respondents reporting a fall in new instructions. Additionally, the shortage of housing inventory worsened further in the capital during July, with the average number of properties for sale per surveyor in London slipping to the lowest figure since February 2014.
Near term expectations for prices also continue to reflect the imbalance between demand and supply with 48% of members expecting prices to continue to rise in London over the next three months. This is the highest level since March 2014. However, rising prices have not dampened interest as new buyer enquiries rose for the fourth month in succession, with 36% of respondents reporting a rise in demand in the capital. Despite this steady and sustained improvement in demand, newly agreed sales continued to decline in London. Going forward, there is more optimism regarding the prospects for activity with 37% more respondents expecting sales to gain momentum over the next three months.
Simon Rubinsohn, RICS Chief Economist, said: " A renewed acceleration in house price inflation allied to a fairly flat trend in sales activity highlights the very real challenges being presented by the housing market. More worrying still is the suspicion that the imbalance between supply and demand will lead to even strong price gains over the next twelve months.
" This is also visible in the firmer pattern in the buyer enquiries series which has now risen for four months in succession reflecting in part, a further modest easing in credit conditions. This trend could be brought to a halt when base rates do eventually begin to rise but the dovish tone to the latest Bank of England Inflation Report suggests the first move will come a little later than previously thought likely and that subsequent increases will be very gradual indeed."
The numbers below are subject to revision as is it usual that some properties are added late to the Land Registry's database.
| Shepherd's Bush Property Prices (April-June 2015) | ||||||||||
|---|---|---|---|---|---|---|---|---|---|---|
| Area | Detached | Sales | Semi-detached | Sales | Terraced | Sales | Flat/ mais |
Sales | Overall Ave | Overall Sales |
| W12 0 | 0 | 0 | 1900000 | 1 | 685719 | 24 | 538375 | 12 | 670750 | 37 |
| W12 7 | 0 | 0 | 515000 | 1 | 998500 | 2 | 370527 | 11 | 470557 | 14 |
| W12 8 | 0 | 0 | 3575000 | 1 | 1383000 | 5 | 475885 | 18 | 793997 | 24 |
| W12 9 | 2850000 | 2 | 0 | 0 | 1134643 | 7 | 517412 | 33 | 731359 | 42 |
| Total | 2850000 | 2 | 1996667 | 3 | 876625 | 38 | 488876 | 74 | 693834 | 117 |
| Change over quarter | 83.0% | 50.0% | -7.1% | 90.0% | -3.2% | 15.6% | 11.8% | 36.0% | ||
| Change over year | 73.6% | 200.0% | -3.1% | 65.2% | 20.9% | -38.8% | 41.9% | -19.3% | ||
| Change over three years | 295.0% | -40.0% | 35.2% | 11.8% | 54.2% | -8.6% | 65.7% | -2.5% | ||
| Change over five years | 65.5% | -50.0% | 47.4% | 31.0% | 50.9% | 23.3% | 50.1% | 23.2% | ||
| Change over ten years | 116.3% | - | ||||||||
| Shepherd's Bush Property Prices (January - March 2015) | ||||||||
|---|---|---|---|---|---|---|---|---|
| Area | Semi-detached | Sales | Terraced | Sales | Flat/ maisonette |
Sales | Overall Averages | Overall Sales |
| W12 0 | 645000 | 1 | 566000 | 5 | 538722 | 9 | 554900 | 15 |
| W12 7 | 0 | 0 | 1023333 | 3 | 454885 | 13 | 561469 | 16 |
| W12 8 | 0 | 0 | 1251667 | 3 | 537079 | 19 | 634523 | 22 |
| W12 9 | 1537500 | 1 | 1024389 | 9 | 493933 | 23 | 670226 | 33 |
| Total | 1091250 | 2 | 943725 | 20 | 505109 | 64 | 620744 | 86 |
| Change over quarter | -11.6% | -33.3% | 9.5% | -20.0% | 7.6% | -1.5% | 3.5% | -7.5% |
| Change over year | -16.8% | -33.3% | 19.2% | -51.2% | 23.5% | -22.0% | 11.8% | -31.7% |
| Change over three years | 39.9% | -28.6% | 51.5% | 30.6% | 35.7% | 11.7% | ||
| Change over five years | 62.4% | -4.8% | 68.0% | 12.3% | 53.9% | 6.2% | ||
| Change over ten years | 113.6% | - | ||||||
Source: Land Registry
August 31, 2015