Spectacular End to 2015 for Shepherd's Bush Property Market
Average price jumps by over 10% to above three quarter of a million pounds
The average property price in W12 reached yet another new high in the last three months of 2015, jumping by 10.5% above three quarters of a million pounds.
This rise, from £698,371 to £771,685 means that over the year, the average soared by a huge 28.7%.
What's more, properties at all levels appear to be benefiting from this autumn bounce, including homes at the very top of the market. Though no detached homes changed hands, five semi-detached homes were sold, with an average price close to the £2 million mark at £1,957,600.
The average price of a terraced house, meanwhile climbed from £1,020,105 in the previous three months to £1,057,882. This represented only a small rise of 3.7% but over the year, the average was up by a substantial 22.7%.
This period also saw a reverse of fortune for flats and maisonettes during the period. Following a dismal summer when prices slid by 5.4% from to £462,287, the average price leapt by 17.9% between October and December to reach £544,881.
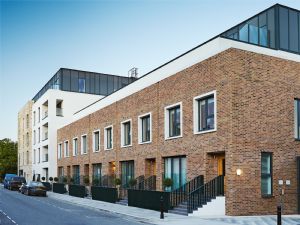
This market is of course most strongly affected by the availability and pricing of apartments in new developments and this period saw the continuing sale of flats at Linden Homes' Parkside Place on Goldhawk Road, where the remaining new properties are available for upwards of £750,000, as well as the first launch of apartments within the redeveloped Television Centre on Wood Lane, with prices starting from £500,00.
With many more flats still to come at this and other schemes such as St James' White City development, which has plans for 1,500 homes, this upward trend looks set to continue in 2016.

Property prices across London rose by 12.4% in 2015 according to the Land Registry bringing the average price of a home in the capital up to £514,097. This was the highest rate of increase in the country.
The average property value in England and Wales was up by 6.4% £188,270. Monthly house prices rose by 1.2% since November 2015.
Sales and repossessions during October 2015, the most up-to-date figures available, show that the number of repossessions in London fell by 71%
The London housing market has seen a fall in newly agreed sales for a third month in a row according to the latest RICS UK Residential Market Survey. Despite an increase in demand across the capital 2% more surveyors have seen a fall in newly agreed sales over the last month, adding to the picture from October and November.
Their report for December 2015 has shown that demand for new properties has reached a three-month high, with Chartered Surveyors citing a rush to beat April’s stamp duty rise as the reason.
From April, buy-to-let investors will be required to pay 3% more in stamp duty charges than residential buyers looking to purchase the same home. Since the Chancellor announced these measures in the Autumn Statement last November, 10% more Chartered Surveyors in London reported a rise in new buyer enquiries but with new instructions flat prices are continuing to rise - average sales per surveyor are at just half of what they were in June 2014.
RICS Chief Economist, Simon Rubinsohn said, “The housing market has experienced an unusually buoyant December. Those in the industry have been speculating that this is the result of the Chancellor’s announcement last November. Potential buy-to-let investors are looking to pick up properties before the increased stamp duty levy comes into force in April. If that is the case, then we can expect to see the housing market heating up further over the next few months.”
The survey also predicted that house prices in London look set to rise by a further 5% per annum in each of the next five years, compared to a UK average of 4.5%, with 57% of contributors in the capital believing that property was either ‘expensive’ or ‘very expensive’.
A net balance of 25% of respondents reported that London house prices had risen since November, substantially lower than the national average of 50%, however price expectations remained strong with a 30% more London surveyors predicting a rise rather than fall in prices over the coming three months.
The numbers below are subject to revision as is it usual that some properties are added late to the Land Registry's database.
| Shepherd's Bush Property Prices (October - December 2015) | ||||||||
|---|---|---|---|---|---|---|---|---|
| Area | Semi-detached | Sales | Terraced | Sales | Flat/ mais |
Sales | Overall Ave | Overall Sales |
| W12 0 | 0 |
0 |
883364 | 11 | 594883 | 9 | 753548 | 20 |
| W12 7 | 1530000 |
1 |
1109500 | 6 | 356000 | 5 | 830583 | 12 |
| W12 8 | 0 |
0 |
570000 | 1 | 538595 | 19 | 540165 | 20 |
| W12 9 | 2064500 | 4 | 1232704 | 12 | 564682 | 31 | 862885 | 47 |
| Total | 1957600 | 5 | 1057882 | 30 | 544881 | 64 | 771685 | 99 |
| Change over quarter | 45.2% | 0.0% | 3.7% | -28.6% | 17.9% | -9.9% | 10.5% | -16.1% |
| Change over year | 58.5% | 66.7% | 22.7% | 20.0% | 16.1% | -1.5% | 28.7% | 6.5% |
| Change over three years | 214.9% | 66.7% | 26.9% | 11.1% | 57.8% | 1.6% | 55.6% | 6.5% |
| Change over five years | 119.7% | 66.7% | 89.4% | -9.1% | 73.8% | 25.5% | 81.0% | 13.8% |
| Change over ten years | 148.0% | - | ||||||
| Shepherd's Bush Property Prices (July-September 2015) | ||||||||
|---|---|---|---|---|---|---|---|---|
| Area | Semi-detached | Sales | Terraced | Sales | Flat/ mais |
Sales | Overall Ave | Overall Sales |
| W12 0 | 686250 | 2 | 813341 | 16 | 453110 | 10 | 675609 | 28 |
| W12 7 | 0 | 0 | 1026250 | 4 | 392688 | 13 | 541762 | 17 |
| W12 8 | 0 | 0 | 1199707 | 7 | 554694 | 17 | 742823 | 24 |
| W12 9 | 1789500 | 3 | 1155200 | 15 | 443758 | 31 | 743939 | 49 |
| Total | 1348200 | 5 | 1020105 | 42 | 462287 | 71 | 698371 | 118 |
| Change over quarter | -32.5% | 66.7% | 16.4% | 10.5% | -5.4% | -4.1% | 0.7% | 0.9% |
| Change over year | -41.5% | 0.0% | -3.5% | -4.5% | -2.8% | -41.3% | 2.7% | -30.6% |
| Change over three years | -5.3% | 25.0% | 44.8% | -25.0% | 40.9% | 0.0% | 33.7% | -9.9% |
| Change over five years | 15.0% | 0.0% | 63.4% | -4.5% | 46.8% | 34.0% | 42.4% | 15.7% |
| Change over ten years | - | 127.0% | - | |||||
Source: Land Registry
February 22, 2016
Related links
|