Hartswood Road House Sets New Record for W12
Highest price paid ever in the area during otherwise quiet start to the year
New price record set in W12 by house in Hartswood Road
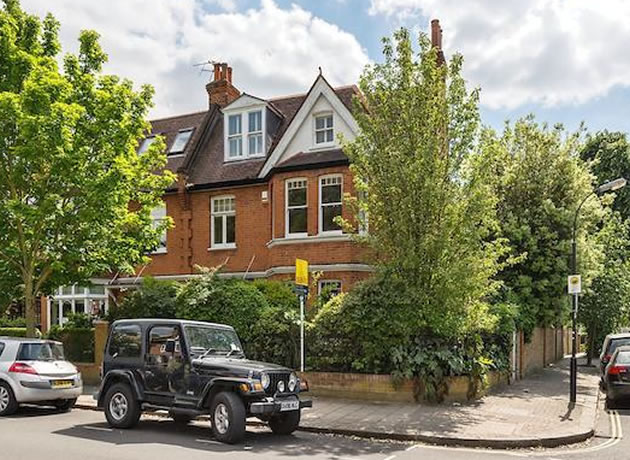
A house in Hartswood Road has achieved a new record price for residential property in the W12 postcode area.
The six bedroom semi-detached house was sold for £3,700,000 after being originally marketed for £3,850,000. The same property was bought for £2,877,000 in 2007.
Six of the top twenty sales in are now in Hartswood Road, in the west of Shepherd's Bush, running north of Stamford Brook.
The first three months of 2016 were otherwise a quiet period for Shepherd's Bush property. The overall average price was £724,754, which is down up 5.6% from £771,685 in the last three months of 2015, but still up 16.8% compared with the same period last year.
This fall from the record levels seen last year were mainly due to a smaller proportion of houses being sold - just five semi-detached and 17 terraced houses compared with 60 flats.
The overall volume of sales was also down by 26.1% from 99 in the previous quarter to 82. However, these cold, dark months are traditionally slow for property sales and estate agents will be hoping the buyers will be back in force as temperatures rise.
In the non-residential sector, Union House on Shepherd's Bush Green has been sold for £30,000,000. The building, at 65 - 69 Shepherd's Bush Green is described as " a bright and contemporary business centre in the heart of fashionable Shepherd's Bush, located in a prime pitch on the west side of the Green.
"The buildings are served by four passenger lifts with private parking to the rear. The building is multi let with a melting pot of varied tenants and a lively community, offering an opportunity to network within."

The Land Registry’s March data for London shows a 13.9% rise over the last year to £534,785. This is higher than any other part of the country and makes London average twice the average for any other part of the country including the South East.
Annual growth of 6.7% in March brings the average house price in England and Wales to £189,901.
Over the last year prices in the London Borough of Hounslow rose by 14.7% to £415,267 and in Ealing borough prices rose by 10.3% to £507,058.
The latest survey by the Royal Institution of Chartered Surveyors (RICS) has revealed that growth in the private and public housing sectors in London slowed down considerably. Private housing workloads rose at their slowest pace since Q4 2012, with only 20% more of those working in the sector reporting a rise in activity rather than a fall over the first quarter of 2016. During the last quarter of 2015 that figure was 44 per cent.
This easing in the private housing sector has not been offset by any increase in the construction of public housing, with growth in this sector remaining broadly unchanged from the previous quarter, and just 11% more surveyors reporting a rise rather than a fall in activity.
RICS Chief Economist, Simon Rubinsohn said, “On the surface, it might seem surprising that we are witnessing a slowdown in the construction sector just a few months after hearing the Chancellor’s ‘We Are The Builders’ speech, given the Government’s significant commitment to this sector. One might well ask why growth in private housing workloads is softening at a time when policy is firmly focussed on the creation of new starter homes. We have long held the view that starter homes cannot be the only solution. There is an issue around the availability of land on which new houses can be built, and we would like to see more being done to free up private brownfield sites.
“Our survey tells us that planning delays are one of the biggest barriers to growth in the construction sector. We have recommended that councils work together to create a team of emergency planners who can parachute into boroughs that are experiencing significant delays, therefore reducing a major growth barrier.
“That said, we cannot discount the climate of uncertainty caused by the forthcoming EU referendum. We know that a range of sectors have been affected by these issues as investors look to delay.
The numbers below are subject to revision as is it usual that some properties are added late to the Land Registry's database.
| Shepherd's Bush Property Prices (January - March 2016) | ||||||||
|---|---|---|---|---|---|---|---|---|
| Area | Semi-detached | Sales | Terraced | Sales | Flat/ mais |
Sales | Overall Ave | Overall Sales |
| W12 0 | 1075000 | 2 | 817170 | 5 | 583741 | 5 | 762880 | 12 |
| W12 7 | 0 | 0 | 1345700 | 5 | 434933 | 15 | 662625 | 20 |
| W12 8 | 0 | 0 | 2150000 | 1 | 487650 | 15 | 591547 | 16 |
| W12 9 | 2259167 | 3 | 1105833 | 6 | 565821 | 25 | 810530 | 34 |
| Total | 1785500 | 5 | 1152903 | 17 | 515050 | 60 | 724754 | 82 |
| Change over quarter | -8.8% | 0.0% | 9.8% | -48.5% | -7.8% | -17.8% | -5.6% | -26.1% |
| Change over year | 63.6% | 150.0% | 22.2% | -15.0% | 2.0% | -6.3% | 16.8% | -4.7% |
| Change over three years | - | - | 53.4% | -63.0% | 46.5% | -23.1% | 45.0% | -33.9% |
| Change over five years | 68.2% | 66.7% | 88.3% | -43.3% | 64.5% | -13.0% | 71.3% | -19.6% |
| Change over ten years | 162.3% | -16.7% | 175.1% | -67.3% | 120.0% | -9.1% | 117.5% | -33.9% |
| Shepherd's Bush Property Prices (October - December 2015) | ||||||||
|---|---|---|---|---|---|---|---|---|
| Area | Semi-detached | Sales | Terraced | Sales | Flat/ mais |
Sales | Overall Ave | Overall Sales |
| W12 0 | 0 |
0 |
883364 | 11 | 594883 | 9 | 753548 | 20 |
| W12 7 | 1530000 |
1 |
1109500 | 6 | 356000 | 5 | 830583 | 12 |
| W12 8 | 0 |
0 |
570000 | 1 | 538595 | 19 | 540165 | 20 |
| W12 9 | 2064500 | 4 | 1232704 | 12 | 564682 | 31 | 862885 | 47 |
| Total | 1957600 | 5 | 1057882 | 30 | 544881 | 64 | 771685 | 99 |
| Change over quarter | 45.2% | 0.0% | 3.7% | -28.6% | 17.9% | -9.9% | 10.5% | -16.1% |
| Change over year | 58.5% | 66.7% | 22.7% | 20.0% | 16.1% | -1.5% | 28.7% | 6.5% |
| Change over three years | 214.9% | 66.7% | 26.9% | 11.1% | 57.8% | 1.6% | 55.6% | 6.5% |
| Change over five years | 119.7% | 66.7% | 89.4% | -9.1% | 73.8% | 25.5% | 81.0% | 13.8% |
| Change over ten years | 148.0% | - | ||||||
Source: Land Registry
May 31, 2016
Related links
|