Shepherd's Bush Property Market Still Stuck in Slow Lane in 2018
But agent says increase in first time buyers is 'light at the end of the tunnel'
Like surrounding areas in West London, the property market in Shepherd's Bush remains at a low ebb in 2018.
The latest figures from the Land Registry reveal both prices and sales figures dropping in the second quarter of the year.
The number of sales slumped to 43, down by over 50% on the total in the same period last year. And while late additions to the registry mean the end figure may well be adjusted upwards, it is a far cry from the booming market of three years ago, when 117 sales were recorded between April and June 2015.
The overall average price also slipped, and as with the first quarter of 2018 this was mainly due to W12's increasing popularity with younger buyers with smaller sized wallets.
Once again, the figures show Shepherd's Bush remains a haven for first timers, with 11 flats changing hands for under £400,000.

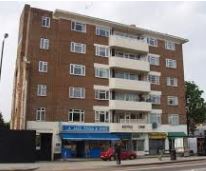
These included a number of flats on the White City Estate and Melville Court on Goldhawk Road, where one flat was sold for £267,500.
Among the new developments in Shepherd's Bush, just three sales were recorded - an apartment in Wood Crescent, within Television Centre and two terraced houses in Ashchurch Villas in Goldhawk Road.
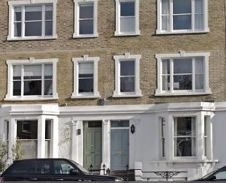
And though the number of sales stayed low, the average price of terraced houses showed a small rise of 6.5% to £1,110,920 with most priced between £1 million and £2 million. The highest price fetched during April and June was for a six bedroom house in Leysfield Road, pictured below, which changed hands for £2,248,980.

Local estate agent Kerr & Co acknowledge that 2018 has been to be a difficult year for home sellers, with necessary reductions in prices. However, they add: " There is light at the end of the tunnel – there are more first time buyers registering, the Government's stamp duty changes have helped those looking at the bottom of the chain.
" As more register and secure their first purchase this allows those selling to go on to buy themselves thus increasing buyer demand and therefore underpinning the market."
The latest House Price Index data published by the Land Registry shows that London prices are the only ones that have fallen over the last year (to May) with the average now £478,853.
Figures for July from the Nationwide House Price Index show that the average price of a home in the UK rose by 2.5% to £217,010.
The was before the Bank of England’s Monetary Policy Committee (MPC) will increased rates at their next meeting at the beginning of the month from 0.5% to 0.75%.
There is not a high degree of concern that the rise in interest rates will have much impact on the property market. Commenting on the figures, Robert Gardner, Nationwide's Chief Economist, said, “Providing the economy does not weaken further, the impact of a further small rise in interest rates on UK households is likely to be modest.
“This is partly because only a relatively small proportion of borrowers will be directly impacted by the change. Most lending on personal loans and credit cards is fixed or tends to be unaffected by movements in the Bank Rate. Similarly, in recent years, the vast majority of new mortgages have been extended on fixed interest rates.”
The numbers below are subject to revision as is it usual that some properties are added late to the Land Registry's database.
| Shepherd's Bush Property Prices (April - June 2018) | ||||||||
|---|---|---|---|---|---|---|---|---|
| Area | Semi-detached | Sales | Terraced | Sales | Flat/ mais |
Sales | Overall Ave | Overall Sales |
| W12 0 | 622500 | 2 | 576286 | 7 | 397000 | 1 | 567600 | 10 |
| W12 7 | 0 | 0 | 1220000 | 2 | 418333 | 3 | 739000 | 5 |
| W12 8 | 0 | 0 | 1426250 | 2 | 516389 | 9 | 681818 | 11 |
| W12 9 | 0 | 0 | 1472622 | 8 | 559069 | 9 | 988977 | 17 |
| Total | 622500 | 2 | 1110920 | 19 | 515051 | 22 | 783340 | 43 |
| Change over quarter | -26.8% | 0.0% | 6.5% | -13.6% | -30.3% | -63.9% | -4.5% | -49.4% |
| Change over year | -68.2% | -33.3% | -10.9% | -40.6% | -2.8% | -60.0% | -5.9% | -52.2% |
| Change over three years | -68.8% | -33.3% | 26.7% | -50.0% | 5.4% | -70.3% | 12.9% | -63.2% |
| Change over five years | - | - | 31.1% | -42.4% | 41.7% | -76.3% | 51.9% | -67.7% |
| Change over ten years | -50.0% | -50.0% | 82.4% | -20.8% | 74.8% | -69.0% | 91.4% | -56.6% |
Source: Land Registry
August 20, 2018
Related links
|

