New Build Flats And Expensive Family Homes Sell Well In Wandsworth
Buyers snapping up family homes around Wandsworth Common and The Toastrack
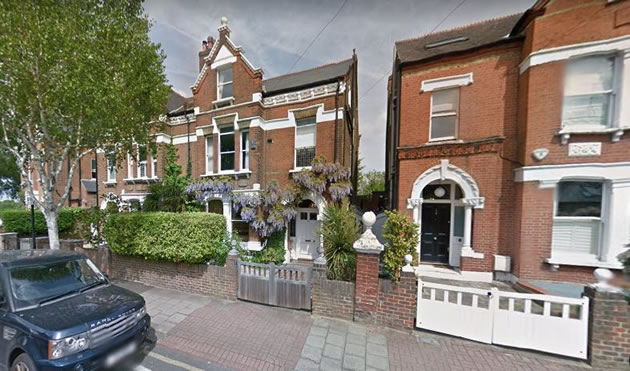
Baskerville Road in the Toastrack where a house sold for £3.85 million. Image: Google Streetview
Demand for new build flats in Wandsworth has returned in recent months according to the latest sales figures published by the Land Registry. There also appears to be a good supply of buyers willing to pay large sums for family homes in the prime areas of Wandsworth Common and The Toastrack, with ten houses selling for over £2 million pounds in the July-September period.
Overall the average price in the SW18 post code area was £789,740 which is 1.9% higher than the same period last year.
Two properties achieved a sale price of over £3 million with homes in Baskerville Road and Dorlcote Road selling for £3,850,000 and £3,100,000 respectively. According to local agents Carter Jonas, although general consumer confidence had actually fallen by September, "The big ticket item purchase sector is still positive."
New build homes in the comparatively reasonably priced (for prime London) Ram Quarter Development in Wandsworth Town centre sold well in the second quarter of this year, indicating that demand for new builds definitely appears to be picking up. Twenty new builds were reported sold during the period so far, nine of which were in Draper's Yard in the Ram Quarter. This marks a significant rise in sales after new build properties almost ground to a halt towards the end of 2017.
The volume of actual sales of flats increased since the Spring by over 50%, while the amount of terraced houses sold has increased by over a quarter since last winter. The sales of semi-detached houses has remained steady over the year.
However Carter Jonas still think Brexit uncertainties, along with the general economy, are dampening the local housing market, "The financial markets, the housing market and the economy generally are sensitive to uncertainty."
According to the Office for National Statistics (ONS) prices fell in Wandsworth borough by 3.8 per cent year-on-year, the fourth biggest drop in London after Westminster, Hammersmith & Fulham and Southwark. The ONS cites Brexit, heavier stamp duty taxes and stretched affordability as the main reasons for a price drop trend in prime London areas.

Meanwhile the latest figures from the Nationwide’s House Price Index show that prices nationally have continued to rise slowly with the average sale price now £214,534 up by 1.6% over the year.
Commenting on the figures, Robert Gardner, Nationwide's Chief Economist, said, “Looking further ahead, much will depend on how broader economic conditions evolve. If the uncertainty lifts in the months ahead, there is scope for activity to pick-up throughout next year. The squeeze on household incomes is already moderating and policymakers have signalled that interest rates are only expected to raise at a modest pace and to a limited extent in the years ahead.”
The October 2018 RICS UK Residential Market Survey results show the recent softening in new buyer demand beginning to feed into a slightly negative trend for national house prices in the view of the surveyors’ industry body.
The report says, “A sustained softening in demand over recent months has likely driven the weaker price trends in parts of the country. The net balance for new buyer enquiries ticked down to -14% in October (compared with -12% last month), marking three successive reports in which headline demand has deteriorated. Affordability pressures, political uncertainty and a lack of fresh stock coming onto the market all continue to hinder activity to varying degrees.”
The report adds that new instructions to surveyors continue to fall meaning stock levels remain close to all-time lows and rendering any chance of a meaningful turnaround in the near future unlikely. A net balance of 30% of respondents reported the level of appraisals being undertaken to be down on an annual comparison.
Looking ahead, respondents in London and the South East were the most negative with price falls expected over the next twelve months.
If your agent is claiming to be marketing your property effectively and it doesn't appear on WandsworthSW18.com it may be time to choose a new agent.
The numbers below are subject to revision as is it usual that some properties are added late to the Land Registry's database.
Property Prices in Wandsworth SW18 (July - September 2018) |
||||||||
| Area | Semi-det | Sales | Terraced | Sales | Flat/ mais |
Sales | Overall average | Total sales |
|---|---|---|---|---|---|---|---|---|
| SW18 1 | 0 | 0 | 1034167 | 9 | 592127 | 44 | 699279 | 54 |
| SW18 2 | 1065000 | 3 | 1260559 | 11 | 468740 | 21 | 768706 | 35 |
| SW18 3 | 2016500 | 10 | 1038483 | 18 | 510270 | 25 | 973858 | 53 |
| SW18 4 | 980667 | 3 | 866136 | 7 | 475477 | 28 | 587324 | 38 |
| SW18 5 | 0 | 0 | 1060140 | 25 | 526533 | 15 | 876439 | 41 |
| Total | 1643875 | 16 | 1063326 | 70 | 525303 | 133 | 789740 | 221 |
| Change in quarter | -23.1% | 60.0% | 9.6% | 4.5% | -11.6% | -50.0% | 10.1% | -35.8% |
| Change in year | 23.9% | -5.9% | 5.3% | -17.6% | -7.5% | -31.8% | 1.9% | -26.6% |
| Change in three years | -12.7% | 14.3% | 6.2% | -42.6% | -3.7% | -55.7% | 8.6% | -49.5% |
| Change in five years | 33.1% | -15.8% | 21.5% | -52.4% | 18.2% | -48.4% | 22.6% | -48.4% |
| Change in ten years | 31.1% | 128.6% | 71.1% | -5.4% | 43.6% | 10.8% | 60.8% | 8.9% |
Copyright notice: All figures in this article are based on data released by the Land Registry(© Crown copyright 2018). The numbers are derived from analysis performed by wandsworthsw18.com. Any use of these numbers should jointly attribute the Land Registry and wandsworthsw18.com.
March 13, 2019