Crossrail Uncertainty Hampers Acton Property Market
But four homes sold for over £2million in one road within three months
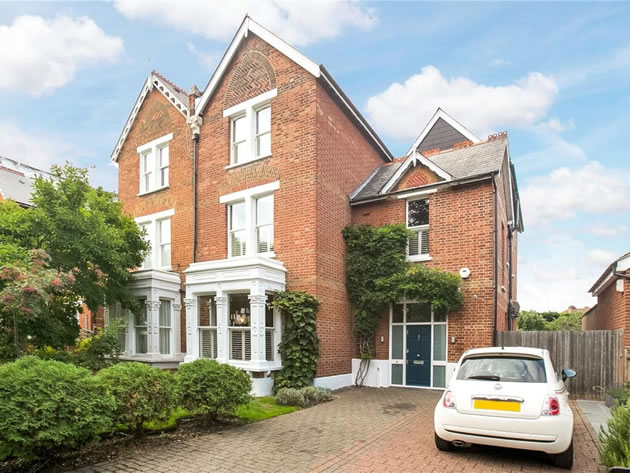
House in Shaa Road went for £2,500,000
Acton property prices fell by an average of 4% in 2018 according to figures released by the Land Registry.
The optimism about the area driven by Crossrail seems to have slowly dissipated as the project is further delayed and Brexit uncertainty continued to weigh heavily. This has hit demand for flats both in the primary and secondary market although the average price of this kind of property seems to have stabilised around the £400,000 level in the W3 postcode area.
A local agent said, "Crossrail is still going to happen but we have clients who bought property here a few years ago in the expectation of being able to use it to get to work by now. It is harder to convince people today that they can believe the current timetable for opening."
Overall the average price in the fourth quarter of 2018 was £594,694 boosted by a number of high priced sales of family houses. Four houses in Shaa Road were sold for over £2,000,000 towards the end of last year including the property originally reported as selling for £6,200,000 by the Land Registry, the price of which has now been corrected to £2,600,000.
Granta Court, Trinity Way, the development of flats close to the A40 off East Acton Lane continues to be the only one in the area generating significant sales with ten units being reported as sold to the Land Registry in the fourth quarter. It has been suggested to us that the flats sold so far are the ones with the better views pointing away from the main road and many of the remaining units will be difficult to sell in the current market.
One local property expert commented, "My view is that many of the developments being marketed at the moment are overpriced and much better value exists in the secondary market. Units in developments like Bromyard House are under priced relative to the new builds and will probably deliver a significant capital gain if we avoid a no deal Brexit "

UK house prices grew by 2.5% in the year to December 2018. This is the lowest annual growth for the UK since July 2013. London property prices fell marginally over the year with only the North East also seeing a decline.
Tom Bill, Partner and Head of London Residential Research at Knight Frank said, "The influence of political uncertainty on the prime London property market has grown markedly in the last six months. In the first half of 2018 there were signs the market was beginning to rally as asking prices adjusted more fully to reflect higher transaction costs.
"However, with Brexit uncertainty persisting ahead of the UK’s planned departure from the EU, sales volumes in prime outer London were down by 10% year-on-year in January and the annual price decrease widened to 4.6%.
"Identifying individual factors affecting the performance of the prime London property market can be a complex task but the impact of political uncertainty was decisive during 2018. Indeed, economic sentiment indicators displayed a similar trend. The Lloyds business barometer began the year with a reading of 35% in January but had fallen to 17% by December.
"However, there are signs that pent-up demand is building. The number of new prospective buyers registering rose by 5% across prime London markets in 2018. Indeed, the ratio of new demand to new supply rose to 4.9 in the final quarter of 2018, the highest level in four years.
While it is unknown when the current level of political uncertainty will recede, the conditions for a recovery in the London property market appear to be taking shape.
Robert Gardner, Nationwide's Chief Economist, said ““Indicators of housing market activity, such as the number of property transactions and the number of mortgages approved for house purchase, have remained broadly stable in recent months, but forward-looking indicators had suggested some softening was likely.
“In particular, measures of consumer confidence weakened in December and surveyors reported a further fall in new buyer enquiries towards the end of 2018. While the number of properties coming onto the market also slowed, this doesn’t appear to have been enough to prevent a modest shift in the balance of demand and supply in favour of buyers in recent months.”
The Bank of England’s Agents’ summary of business conditions for 2018 Q4 reported that along with low supply of houses, demand was also falling. Housing activity in southern England was muted due to uncertainty, with transactions postponed until after the EU withdrawal. The demand for new build houses remained stronger outside London, in part due to house builders offering more incentive to finalise sales.
The Royal Institution of Chartered Surveyors’ (RICS) UK Residential Market Survey for December 2018 reported that new buyer enquiries fell for the fifth month in a row. This fall in demand was accompanied by a lack of fresh stock coming into the market as the survey’s indicator on new instructions remained in negative territory for the sixth report in a row.
The UK Property Transactions Statistics for December 2018 showed that on a seasonally adjusted basis, the number of transactions on residential properties with a value of £40,000 or greater was 102,330. This is 3.6% higher than a year ago. Between November 2018 and December 2018, transactions fell by 0.1%.
The Bank of England’s Money and Credit latest release showed that mortgage approvals for house purchases (an indicator of future lending) were around 63,800 in December, unchanged from November, but slightly below their 2018 average of around 65,200.
There are regular updates on the local property market in the ActonW3.com newsletter. To register to receive it .
| Acton Property Prices (October - December 2018) | ||||||||||
|---|---|---|---|---|---|---|---|---|---|---|
| Area | Detached | Sales | Semi-det | Sales | Terraced | Sales | Flat/ mais |
Sales | Overall Ave |
Total Sales |
| W3 0 | 0 | 0 | 698333 | 3 | 720000 | 3 | 797500 | 2 | 731250 | 8 |
| W3 6 | 0 | 0 | 773000 | 2 | 951300 | 5 | 351962 | 20 | 494139 | 27 |
| W3 7 | 2600000 | 1 | 1257143 | 7 | 798333 | 3 | 396478 | 23 | 673941 | 34 |
| W3 8 | 0 | 0 | 1170000 | 2 | 627500 | 4 | 429000 | 11 | 562882 | 17 |
| W3 9 | 0 | 0 | 0 | 0 | 0 | 0 | 417667 | 3 | 417667 | 3 |
| Total | 2600000 | 1 | 1055786 | 14 | 788100 | 15 | 402123 | 59 | 594694 | 89 |
| Change in Quarter | - | - | 2.2% | -12.5% | -2.5% | -34.8% | -2.0% | -37.2% | 5.3% | -34.1% |
| Change in year | - | - | 4.0% | 0.0% | 8.0% | -16.7% | -5.2% | -11.9% | -4.0% | -12.7% |
| Change in three years | - | - | 13.6% | 27.3% | -5.2% | -54.5% | -8.2% | -40.4% | 4.4% | -38.6% |
| Change in five years | - | - | 24.0% | -46.2% | 17.6% | -61.5% | 33.1% | -53.2% | 29.3% | -53.9% |
| Change in ten years | - | - | 159.6% | 16.7% | 107.3% | 66.7% | 58.9% | 73.5% | 93.4% | 61.8% |
March 12, 2019
Related links
|