Goldhawk Road's Unique Long House Boosts W12 Property Market
But overall sales slump as homeowners sit it out due to Brexit uncertainty
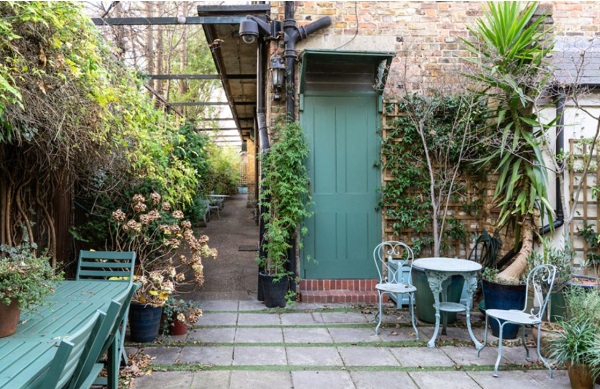
The Long House courtyard off Goldhawk Road
The sale of one of the most unusual properties in Shepherd's Bush, an 'industrial home' in Goldhawk Road created within a cluster of offices and workshops formerly used by jewellery company Ratner Group, gave the market a welcome boost during the third quarter of 2019.
The eight bedroom property known as the Long House, set around a picturesque courtyard, was the most expensive sale between July and September, changing hands for £2,820,000.
The others, all newly built, were a house within the upmarket gated development Aubury Place in Emlyn Road and two apartments In the redeveloped Television Centre in Wood Lane.
Television Centre is still the star performer in Shepherd's Bush, with 13 sales recorded during the period, priced from £785,000 to £2.350,000.
Despite these high prices however, the overall average property price, £740,976, was down 8.9% over the previous quarter and a substantial 17.3% from the same period in 2018.
While this may sound like grim news for local estate agents, the silver lining is that Shepherd's Bush is becoming a haven for young people in search of affordable properties.
The figures from the Land Registry show that in this quarter, a number of one bedroom and studio ex-council flats around the White City and Old Oak Estates changed hands for under £300,000.
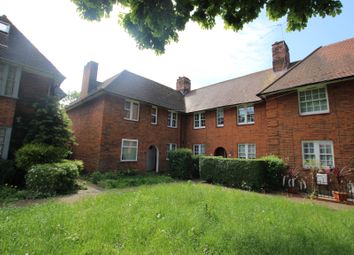 Henchman Street
There were also some terraced houses priced under £500,000 - prices unheard of elsewhere in our borough. They included a two bedroomed house in Henchman Street, close to Du Cane Road and Wormwood Scrubs, which was sold for just £352,000.
However it is clear that, as in surrounding areas, the twin shadows of Brexit and this week's General Election are still looming over W12. Sales during the period remained subdued, down by almost a half on the previous year, as people waited it out for normality to return.
Local agent Thorgills believes that this lack of properties could have a positive effect in 2020. In its latest market report the agent says: " The number of properties coming to the market has decreased by 1.7% since this time last year, so an increasing number of buyers are competing for fewer properties – which will drive up prices.
"Average prices nationwide have already risen by 3% annually since the last general election, and as cautious homeowners hold off from joining the market until after this one, the supply gap will widen and prices will rise further."
Finlay Brewer's Teresa Brewer also strikes an optimistic note as we approach a new year. saying: "Elections tend to create a short-term hiatus in house sales and we were interested to see the latest figures from Rightmove: The number of new sellers bringing their homes to the market is down 14.9% compared with this time last year. It is the biggest year-on-year slump in any month since August 2009. Added to the fact that Christmas is just around the corner, it is understandable that people are not focusing on selling their property right now.
"Uncertainty has meant a lot of people were already sitting on their hands when it came to moving home – they wanted to see what would happen before making a commitment. Three and a half years on from the referendum, they’re still waiting and every year this number grows. This is going to create a substantial amount of pent-up demand.
"The good news is, that once it’s all over, this demand could be released onto the spring market early… in February rather than March/April."

The numbers below are subject to revision as is it usual that some properties are added late to the Land Registry's database.
| Shepherd's Bush Property Prices - (July - September 2019) | ||||||||
|---|---|---|---|---|---|---|---|---|
| Area | Semi- Det |
Sales | Terraced | Sales | Flats/ Mais |
Sales | Overall Ave | Total Sales |
| W12 0 | 0 | 0 | 791708 | 13 | 433800 | 8 | 655362 | 21 |
| W12 7 | 0 | 0 | 927000 | 5 | 871590 | 18 | 883635 | 23 |
| W12 8 | 0 | 0 | 1121750 | 4 | 435000 | 12 | 606687 | 16 |
| W12 9 | 2350000 | 1 | 1231250 | 4 | 476909 | 11 | 782562 | 16 |
| Total | 2350000 | 1 | 936123 | 26 | 604592 | 49 | 740976 | 76 |
| Change over quarter | -3.9% | -50.0% | 6.5% | 30.0% | -12.3% | 32.4% | -8.9% | 28.8% |
| Change over year | 124.6% | -75.0% | -10.9% | -7.1% | -29.2% | -58.5% | -17.3% | -49.3% |
| Change over three years | 88.5% | -66.7% | -3.2% | -7.1% | 15.6% | -21.0% | 9.0% | -18.3% |
| Change over five years | 1.9% | -80.0% | -11.4% | -40.9% | 27.1% | -59.5% | 9.0% | -55.3% |
| Change over ten years | 226.8% | -85.7% | 72.3% | -27.8% | 103.5% | -7.5% | 76.4% | -20.8% |
Source: Land Registry
December 10, 2019